(This topic is covered in detail in Journal Issue No. 02)
The benefits and uses of Numerical Descriptive Statistics in business
Even though it is fundamental, descriptive statistics play a vital role in business, e.g., it allows a business to understand consumer behavior better, helps your firm spot trends and potential problems. Since there are vast amounts of data in today’s organization, if we simply presented the raw data it would be hard to visualize what the data was showing. Descriptive statistics therefore enable us to present the data in a more meaningful way, which allows for simpler interpretation.
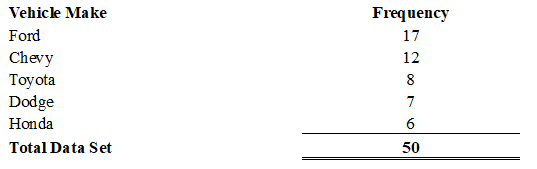
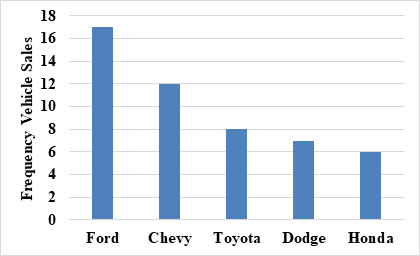
Descriptive statistics comes in two forms, graphical and numerical. Graphical are simply charts and tables – shown below is a summary of vehicle sales at a used car dealership.
 |
 |
|---|
Whereas numerical descriptive statistics looks at the statistical numbers of a data set including KPIs such as year-over-year percentage sales growth, average revenue per customer, and average length of time a visitor spends on your website.
However, numerical descriptive statistics goes into much more detail than simple averages, and the key is knowing which technique to use for each specific situation (standard average, weighted average, geometric average, etc.).
Another powerful descriptive method used in business is that of correlation. Correlations are the association between variables. It can be vastly important for a business to discover if variables are correlated since they can have a substantial impact on profits. We use various applied statistics to solve the numerical value of the correlation and present it in a descriptive fashion. The graph below shows a strong (0.95) positive correlation.

The Journal will discuss two methods for calculating correlation in business, knowing which one to use is of vital importance to avoid erroneous results.
One correlation that we are all familiar with is that of education level versus annual salary. Looking at the data from the U.S. Bureau of Labor Statistics (https://www.bls.gov/careeroutlook/2018/data-on-display/education-pays.htm), one can calculate the correlation at approximately 0.98, i.e., there is a strong positive correlation between ones education level and the amount of money they make.
Here are some examples of how businesses use correlation:
Insurance
Is there correlation between accident rate and age, and sex of the driver?
Finance
Personal loan default rate vs. age, gender, and income of borrower
Retail sales
Total sales vs. day of the week
Total ice cream sales vs. the outside temperature
Manufacturing
Productivity vs. day of the week or time of day
Marketing
The correlation between newspaper ad and sales revenue
TV ad and sales revenue
Radio ad and sales revenue, etc. etc.
I’m sure you can think of countless others based on your specific business.
Applied business statistics also aim to discover the central tendency of a data set. In business, in addition to measures of location, sometimes (often), measures of variability are necessary to get a true picture of the data. As an example, a manufacturer of motorcycles outsourced its tires from two different suppliers and it wanted to analyze which had better delivery performance. They gathered a group of data of their past 100 shipments from Supplier A and Supplier B. What they discovered was that the average delivery time for each supplier was 12.5 days, but does that tell whether the two suppliers are equally reliable? The histograms below should tell you in an instant that they are not.


The above example is an illustration of variability and how critical it can be in the decision-making process.
There are several methods to find the central tendency of your firm’s data, and we discuss them in detail in The Journal.
Applied business statistics have countless applications in helping businesses grow and become successful. One of the applications of statistics in business is that of Lean Six Sigma (LSS). Lean Six Sigma is a combination of two successful Process Improvement methods – Lean and Six Sigma.
Lean is a way of thinking about creating customer value with fewer resources and less waste to drive continuous improvement and to achieve perfect value with zero waste.
Six Sigma focuses on identifying and eliminating anything that caused variation in the process. When process variation is gone, process results can be precisely predicted.
The journal will go through the entire process of LSS and how to apply it to your business. Correlation and central tendency are key elements of the Lean Six Sigma process.